

OpenTelemetry: Instrument Once, Choose the Backend Freely
Observability eats up budget and ties you to a provider. OpenTelemetry decouples instrumentation from the backend: measure once, choose tool freely.
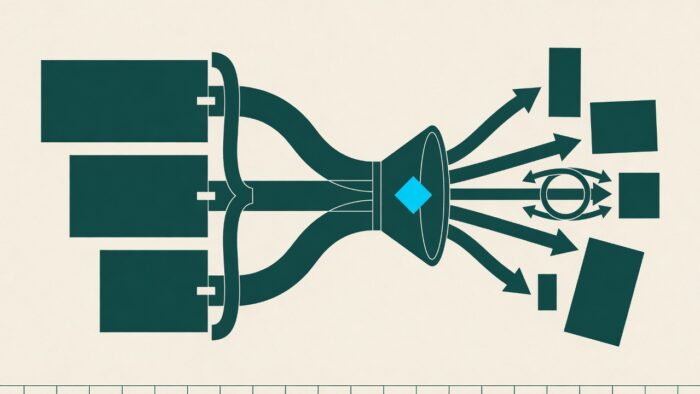
For three years, every trace ran through a single vendor’s agent – convenient and expensive. Then the bill climbed, the team wanted to switch to a different backend, and realised: every single span was glued to the vendor’s SDK. Changing your observability stack meant rebuilding it from scratch. That exact dead end is what OpenTelemetry solves, by separating the act of measuring from the act of analysing.
Key Takeaways
- Instrumentation and backend are decoupled: Once you instrument with OpenTelemetry, you can swap your analysis tool later – from Jaeger to Prometheus, Grafana, or Datadog. The code stays the same; the destination changes through configuration.
- A widely adopted de facto standard: OpenTelemetry is a graduated project of the Cloud Native Computing Foundation and, after Kubernetes, one of the most active there. Major observability vendors now support the protocol natively.
- The quick start has a flip side: Auto-instrumentation is up in minutes – the real work begins with the Collector, with sampling, and with the question of which data you actually want to keep.
Related:OpenTofu vs. Terraform: which IaC tool really holds up / Coolify reviewed: self-hosting instead of Vercel and Heroku
Why the observability bill eventually becomes a hostage situation
The pattern repeats itself in almost every stack I’ve seen from the inside over the past few years. It starts with an agent. You install it, a few lines of config, and suddenly traces, metrics, and logs appear in a tidy dashboard. The vendor makes it deliberately easy – because every instrumented service is a service that won’t be leaving its backend any time soon.
The friction comes later. Data volume grows faster than planned, the bill follows the volume, and at some point the question surfaces whether a different tool might be cheaper – or simply better. That’s when you discover how deep the hook goes. Spans carry class names from the vendor’s SDK, metrics follow its naming scheme, sampling logic lives inside its agent. Switching isn’t a configuration job; it’s a refactor across the entire codebase.
This isn’t a criticism of any particular vendor. It’s the logical consequence of packaging measurement and analysis together in the same proprietary bundle. OpenTelemetry draws the dividing line precisely there.
What OpenTelemetry Actually Does, Once You Put the Slides Away
What is OpenTelemetry? OpenTelemetry is an open standard for generating and transporting telemetry data in distributed systems. It defines vendor-neutral interfaces and libraries for the three stable signal types – traces, metrics, and logs – as well as a unified protocol called OTLP through which that data can be sent to any backend of your choosing.
The practical core is this decoupling. Instrumentation lives in the code and in the standard, not in a vendor’s agent. A span is named whatever the team decides to call it, not whatever the SDK imposes. Where the data ultimately flows is a matter of configuration, not a code change.
The project emerged from the merger of two older approaches, OpenTracing and OpenCensus, which spent years solving the same problem side by side. Today OpenTelemetry is a graduated project of the Cloud Native Computing Foundation and, after Kubernetes, the most active project there. Even the commercial vendors whose lock-in the standard disrupts now accept OTLP natively. Vendor-neutral instrumentation has become the default.
Auto or Manual: Where the Quick Start Hits Its Limits
There are two ways into OpenTelemetry, and both are legitimate. Auto-instrumentation attaches itself via an agent or library to common frameworks and drivers, delivering traces for HTTP calls, database access, and message queues without touching a single line of code. This is the path that gets you a first trace picture over a lunch break.
Manual instrumentation takes more effort, but it delivers the context that actually matters. A call like tracer.start_as_current_span(…) marks exactly the business operation you care about during an incident – the checkout, the risk check, the batch run. Auto tells you the database was slow. Manual tells you the database was slow during the third retry of a payment authorization. That’s the difference between a number and an explanation.
| Auto-Instrumentation | Manual Instrumentation |
|---|---|
| Productive in minutes, no code changes required | Per-service effort, but targeted context in return |
| Covers frameworks and drivers, not your own business logic | Maps exactly the business operations that matter when incidents strike |
| Great for an initial overview and standard stacks | Essential once traces are expected to support real decisions |
In practice, you combine both. Auto-instrumentation as a baseline layer, manual spans wherever money, risk, or customer frustration is on the line. Build everything manually and you’ll never be done. Leave everything to the agent and you’ll end up with plenty of data and very few answers.
The Collector is the part most people underestimate
The libraries get the attention, but the OpenTelemetry Collector does the actual work. It’s a standalone process that receives telemetry from services, processes it, and forwards it to one or more backends. This single component turns the theory of vendor-agnosticism into operational reality – because data routing happens here, not in your application code.
otlp:
protocols:
grpc:
processors:
batch:
exporters:
prometheus:
otlp/tempo:
service:
pipelines:
traces:
receivers: [otlp]
processors: [batch]
exporters: [otlp/tempo]
metrics:
receivers: [otlp]
processors: [batch]
exporters: [prometheus]
This minimal config illustrates the principle. A receiver accepts OTLP data, a batch processor groups it, and two separate pipelines send traces and metrics to different destinations. When the team wants to swap the trace backend tomorrow, exactly one exporter line changes – no service needs to be redeployed.
The friction hides in sampling. At moderate volume you can keep everything; under serious traffic that gets expensive and unwieldy fast. Tail-based sampling – making the decision only after a trace completes – selectively retains slow and failed operations while discarding the uniform success case. It’s powerful, but it costs memory in the Collector and takes a few iterations before the rules actually hold. I’ve personally taken that discipline too lightly more often than I’d like to admit.
What the switch gains you – and where it won’t save you
The concrete benefit of OpenTelemetry is freedom of choice. Instrumentation becomes a lasting investment rather than a bet on a single vendor. Backends can be compared, combined, or replaced without opening the codebase each time. For teams wrestling with telemetry costs or tool lock-in, this is the decisive lever.
OpenTelemetry is not a finished observability product. The standard generates and transports data – it doesn’t store, visualize, or alert. The backend remains a separate decision with its own costs, whether self-hosted with Grafana and Prometheus or purchased as a managed service. And the Collector is infrastructure that someone has to run, scale, and monitor. Observability that wants to be observed itself.
For a small team running a manageable monolith with a tool that already fits, an immediate migration serves no purpose in itself. OpenTelemetry pays off once multiple services, multiple languages, or genuine frustration with costs and lock-in converge. At that point the question is no longer whether to switch – only how quickly the old instrumentation can be retired.
Frequently Asked Questions
How does OpenTelemetry differ from a tool like Datadog?
OpenTelemetry is the vendor-neutral standard for generating and transporting telemetry data – not a finished analysis tool. Datadog and comparable vendors provide the backend: storage, dashboards, and alerting. The two work hand in hand: you instrument with OpenTelemetry and send the data to a backend of your choice, one you can swap out later without touching your code.
Do I have to re-instrument all my code from scratch?
No. Auto-instrumentation gives common frameworks, HTTP clients, and database drivers traces immediately, with zero code changes. Manual spans are added selectively, only where business context matters. The typical approach is to start with auto-instrumentation and deepen coverage manually, step by step.
Is the OpenTelemetry Collector strictly required?
For small setups you can send data directly from your services to a backend. Once sampling, multiple destinations, or centralized processing enter the picture, the Collector becomes the pivotal piece. It’s where routing and data volume are controlled – without ever touching application code.
What does OpenTelemetry cost?
The standard and its libraries are open source and free. Costs come not from OpenTelemetry itself, but from your chosen backend and from running the Collector. That separation is precisely what makes it valuable: you can optimize backend costs independently of your instrumentation.
Is switching worth it for a small team?
If a monolith and a well-matched tool are already working smoothly together, migration is no end in itself. But as soon as multiple services or languages enter the mix – or vendor lock-in starts to sting – vendor-neutral instrumentation pays off quickly.
More from the MBF Media Network
MyBusinessFutureAI in the Mittelstand: The Bottleneck Lies in Legacy SystemsDigital ChiefsTechnical Debt: Why the Board Must Act NowSecurityTodayPatch Prioritization: Why CVSS Alone Is Holding Your SOC BackImage source: Rashed Paykary / Pexels
Translated from the German original using artificial intelligence. The German version is authoritative.


